More Winning Secrets Here
Absolute Breadth Index is a stock market technical analysis tool developed by Norman G. Fosback. He first introduced this idea in his book “Stock Market Logic”. Norman G. Fosback used this stock market technical indicator to forecast if stock prices will be higher in three to twelve months time. He found that high indicator values lead to higher stock prices.
Norman G. Fosback's stock market technical indicator looks at the relationship between New York Stock Exchange's Advancing Issues and its Declining Issues.
The formula for calculating Absolute Breadth Index is:
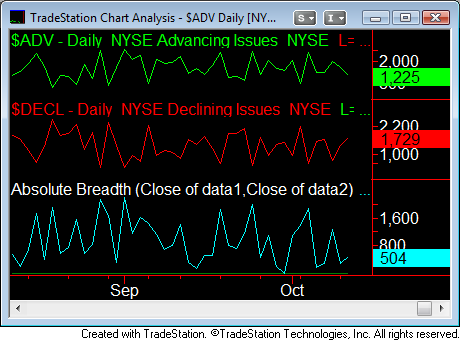
The way to use this indicator is to look for extreme readings. When a high reading is a result of NYSE Advancing Issues, it can be used in conjunction with your Momentum Indicators. Prices are heading higher from general market direction. When a high reading is a result of NYSE Declining Issues, it can used in conjunction with your Volatility Indicators. Look for quick sharp reversals from short covering rallies.
Related links:
Homepage Investment Trading Strategies
Return to Top of Page Stock Market Technical Analysis


If you like this page and you are feeling generous, please give credit for the source with a link back to this page. Help others find the valuable resource available here.
